SolarWinds Observability SaaS
SaaS-delivered Observability built to extend visibility across cloud-native, on-prem, and hybrid technology stacks.
Complete observability built on decades of experience helping IT professionals
SolarWinds Observability SaaS delivers unified and comprehensive visibility for cloud-native, on-premises, and hybrid custom and commercial applications to help ensure optimal service levels and user satisfaction with key business services.
Eliminate tool sprawl and gain comprehensive, single-pane-of-glass visibility with actionable intelligence
Accelerate issue resolution with built-in intelligence and actionable insights driven by data from across the environment
Reduce alert fatigue with AIOps, enhanced with machine learning (ML), and a customized metrics -powered solution designed to automatically prioritize and surface real problems
Accelerate cloud modernization with cloud-native, multi-tenant observability that seamlessly integrates with SolarWinds Observability Self-Hosted to deliver a unified view across multi-cloud, hybrid, and on-premises environments
More dev and deployments, less firefighting
Hybrid application performance monitoring
For internally written and commercial applications. Unified code-level troubleshooting with transaction tracing, code-profiling, and exception tracking combined with end user experience insights through synthetic and real user monitoring.
Open-source database performance monitoring
Deep database performance monitoring. Increase system performance, team efficiency, and infrastructure cost savings by offering full visibility into open-source databases including MySQL®, PostgreSQL®, MongoDB®, Azure® SQL, Amazon Aurora®, and Redis®
SaaS-Delivered hybrid network, on-prem and cloud infrastructure monitoring
Our SaaS offering leverages decades of SolarWinds on-premises network and infrastructure monitoring leadership. A hybrid, full stack offering that includes the monitoring of network devices, SDWAN, servers, VMs, and cloud infrastructure and related services.
Data Center Location Flexibility
Choose one of three regions, Americas, Europe, or Asia Pacific. Having flexibility in choosing your region supports local compliance while reducing latency and optimizing load distribution for enhanced performance.
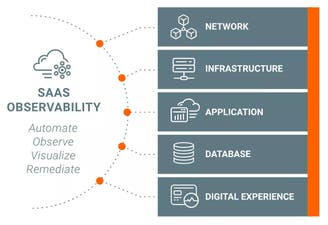
SaaS-Delivered, hybrid, full-stack observability
A versatile solution designed to meet a wide range of use cases. It seamlessly brings together DevOps, IT Ops, and Cloud Ops teams, covering networks, infrastructure, databases, applications, and user experience. Leveraging a native open-source framework and out-of-the-box third-party integrations.
SolarWinds Observability SaaS built for DevOps, IT ops, and Cloud Ops teams.
Hundreds of Observability Integrations


Get started with our
SaaS Hybrid Observability